Earlier this year, I ran a survey to understand how UX teams are using AI in design.

While this data is not conclusive due to its smaller sample size (23 Respondents), it still may give you an indication of how AI is being used and the overall sentiment towards using AI in UX process. I am hoping to build on this survey and run a longer one in 2026.

Survey Link

Summary of Results

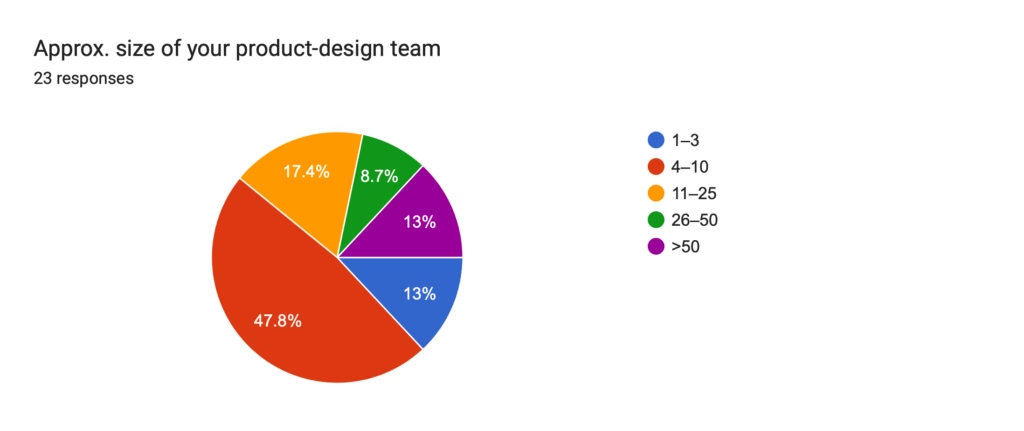
  • Team Size : Most common team size was 4-10
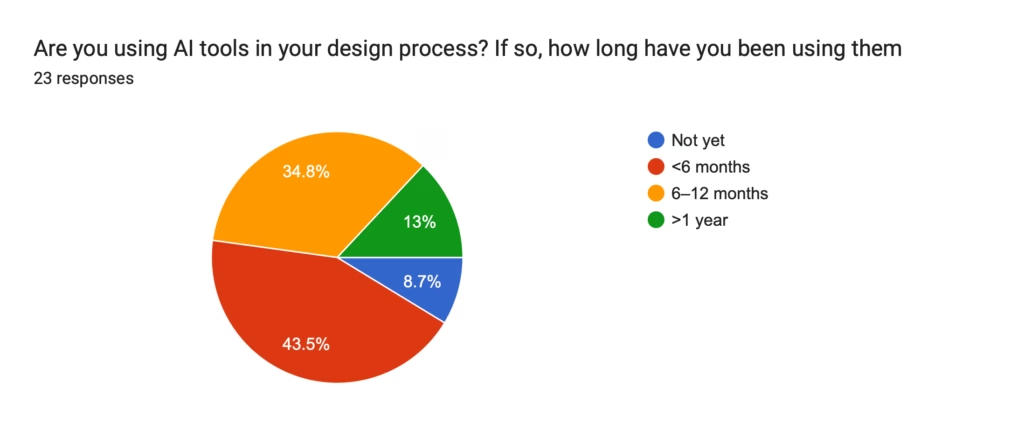
  • Duration of Use : 43.5% have used AI for less than 6 months
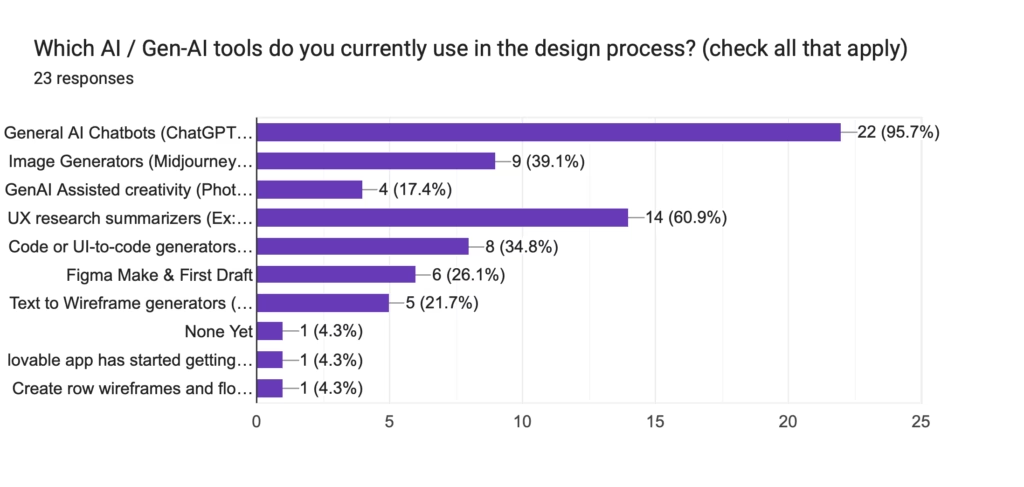
  • Primary Tools: General AI Chatbots were used by 95% designers
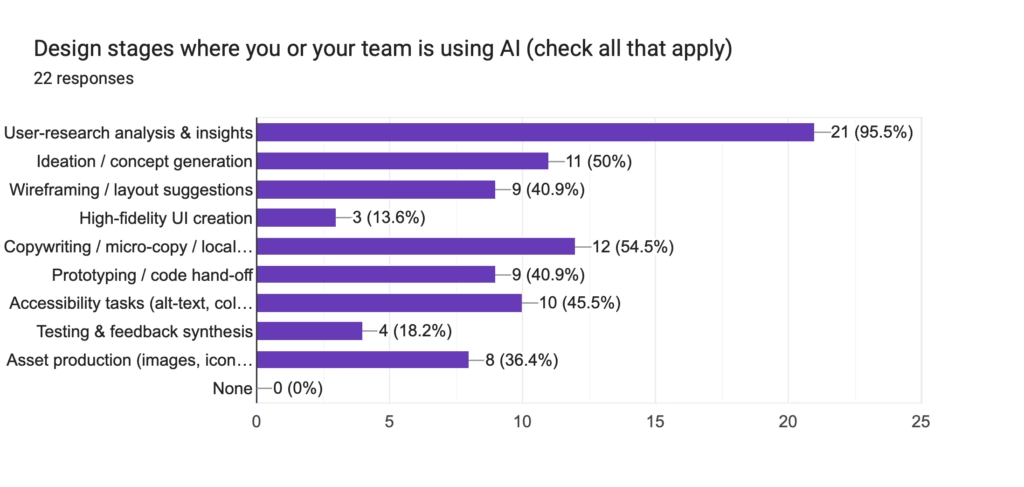
  • Primary Use: User Research Analysis
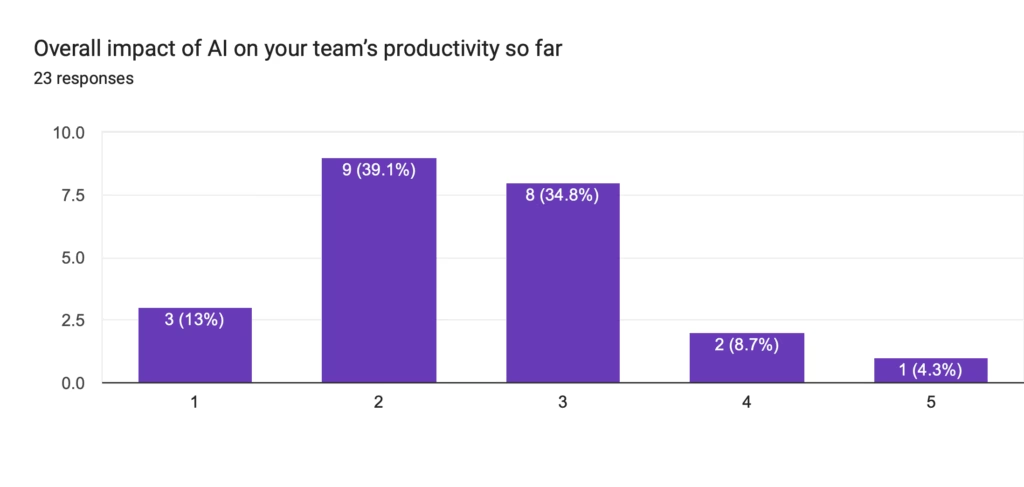
  • Impact : Underwhelming productivity gains – 2/5 reported by 40% of designers
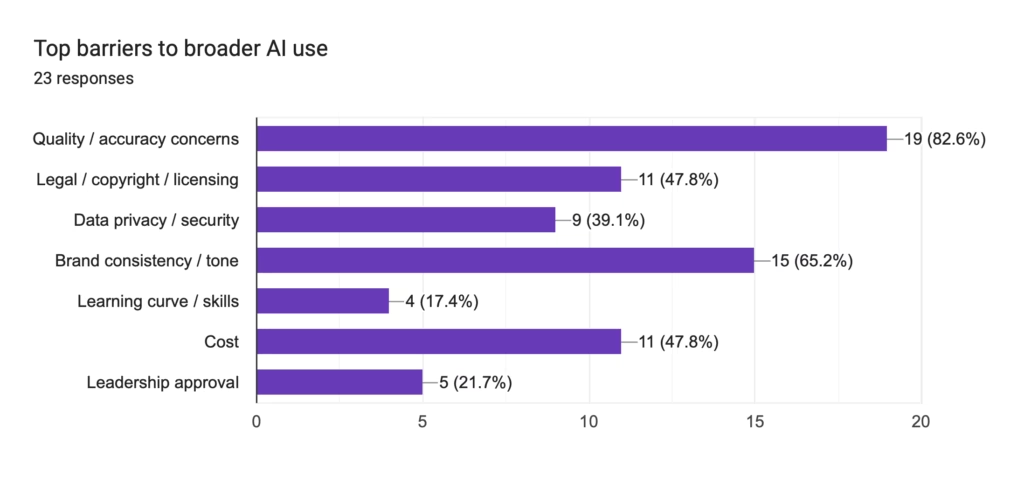
  • Main Barrier : Quality / Accuracy
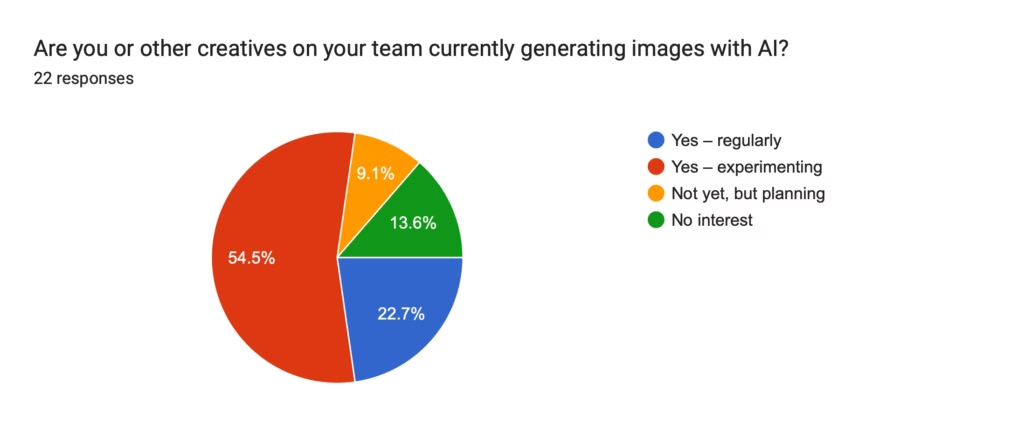
  • AI Generated Image adoption : Still experimenting (54%)
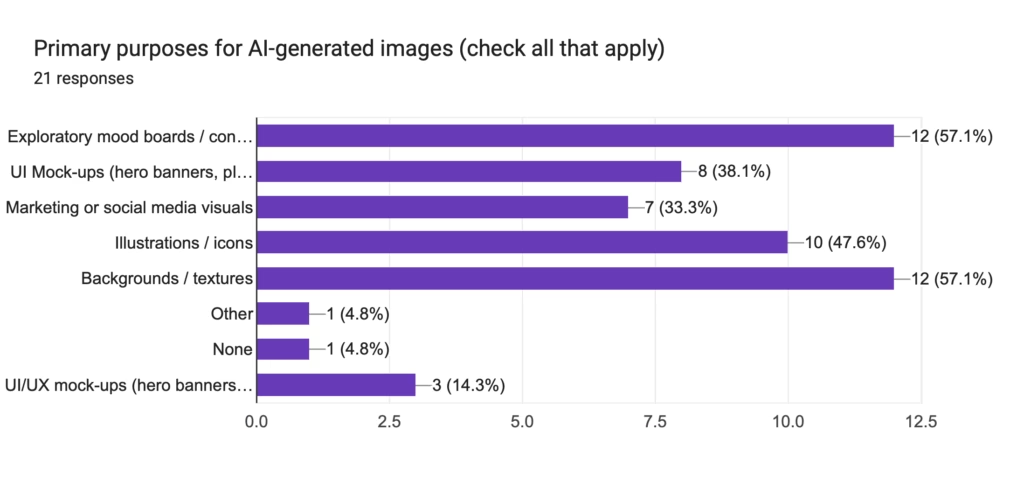
  • Purpose of Generated Images : Designers primarily used them for Mood Boards and Backgrounds
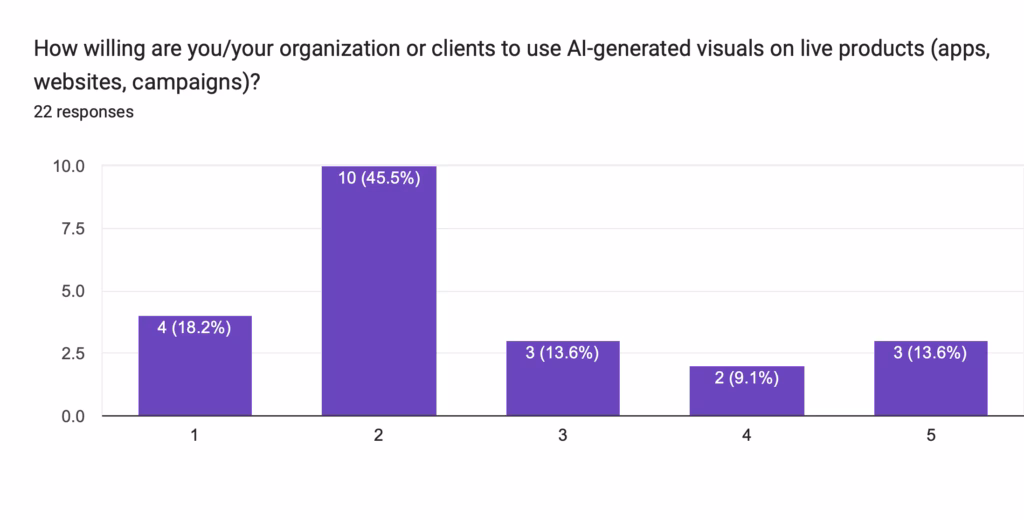
  • Trust Factor : Generally unwilling to use AI Generated designs and images on live production websites
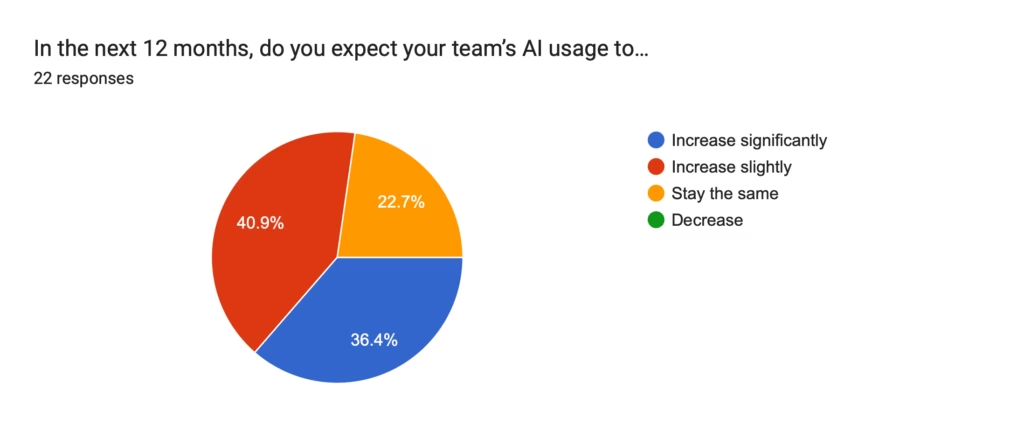
  • Future usage of AI : 77% expects AI usage to increase next year
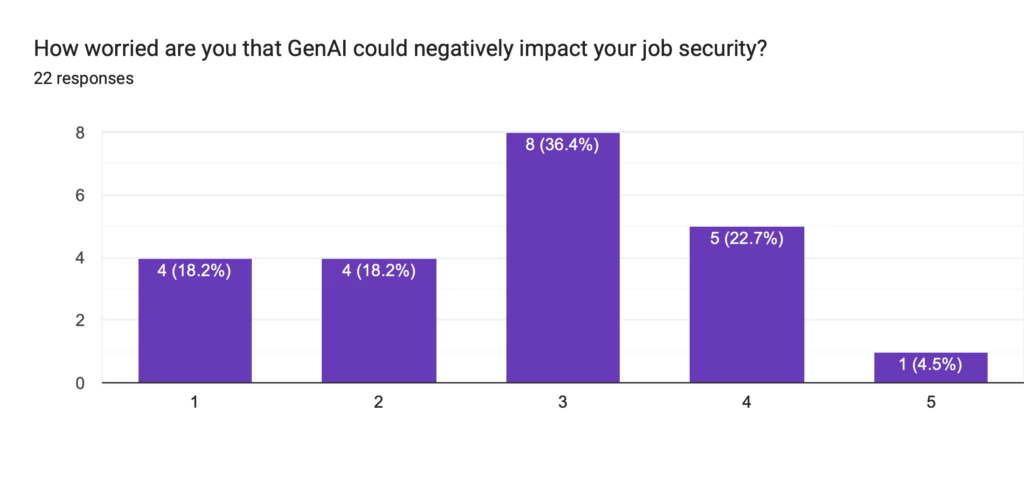
  • Job Security : Majority of respondents are slightly concerned about job security
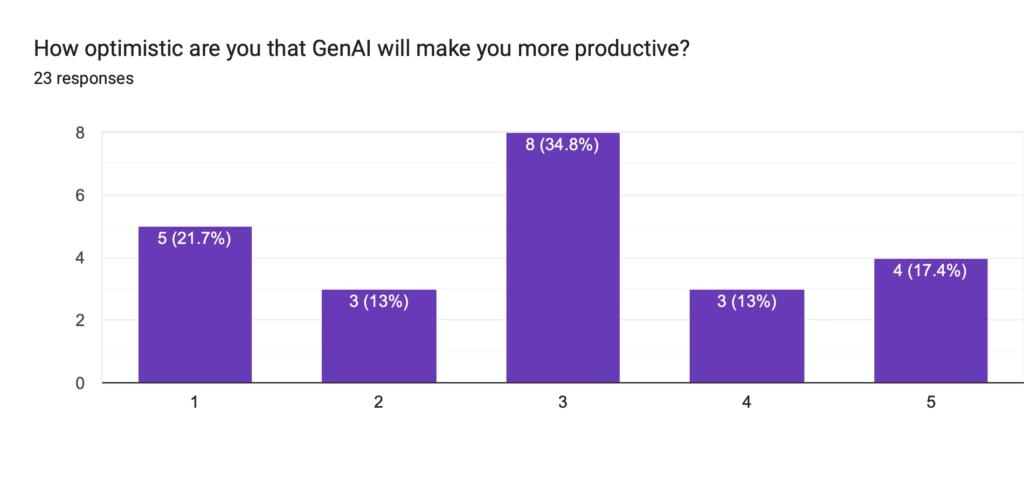
  • Optimism : Majority of designers are moderately optimistic about AI
  • Overall sentiment : Curious and Anxious

Respondents

The respondents were primarily from India where AI tools seem to have gained a lot of traction in workplaces.

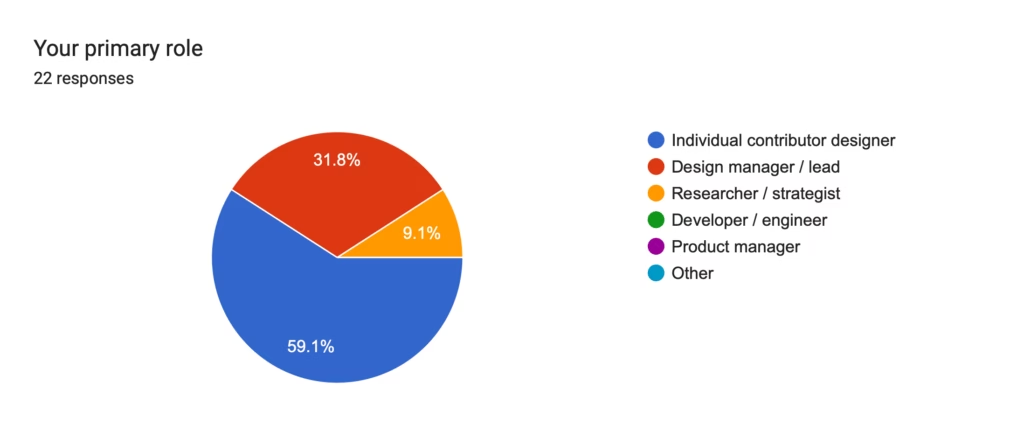
Majority of the respondents were Individual contributors.

A pie chart titled "Your primary role" based on 22 responses. The chart is divided into three segments:

Individual contributor designer (Blue): 59.1%

Design manager / lead (Red): 31.8%

Researcher / strategist (Yellow): 9.1%

Additional roles listed in the legend (Developer / engineer, Product manager, and Other) have 0% representation and do not appear as slices in the chart.

Majority of the respondents were working in smaller teams

A pie chart titled "Approx. size of your product-design team" based on 23 responses. The chart breaks down team sizes as follows:

4–10 (Red): 47.8%

11–25 (Yellow): 17.4%

1–3 (Blue): 13%

>50 (Purple): 13%

26–50 (Green): 8.7%

Majority of the respondents have been using AI for at least six months.

A pie chart titled "Approx. size of your product-design team" based on 23 responses. The distribution is:

4–10 (Red): 47.8%

11–25 (Yellow): 17.4%

1–3 (Blue): 13%

>50 (Purple): 13%

26–50 (Green): 8.7%

Tools & processes

While Figma Make and Code Generators are gaining some traction, majority of the designers are still Chatbots. Some teams are also using Research Summarizers.

A horizontal bar chart titled "Which AI / Gen-AI tools do you currently use in the design process? (check all that apply)" based on 23 responses. The tools are ranked by the number of selections:

General AI Chatbots (ChatGPT, etc.): 22 responses (95.7%)

UX research summarizers: 14 responses (60.9%)

Image Generators (Midjourney, etc.): 9 responses (39.1%)

Code or UI-to-code generators: 8 responses (34.8%)

Figma Make & First Draft: 6 responses (26.1%)

Text to Wireframe generators: 5 responses (21.7%)

GenAI Assisted creativity (Photoshop, etc.): 4 responses (17.4%)

None Yet: 1 response (4.3%)

lovable app has started getting...: 1 response (4.3%)

Create row wireframes and flo...: 1 response (4.3%)

Designers used AI tools primarily to do User Research analysis, copywriting. Code handoff and accessibility tasks (Alt text generation for example) are also gaining traction.

A horizontal bar chart titled "Design stages where you or your team is using AI (check all that apply)" based on 22 responses. The stages are:

User-research analysis & insights: 21 responses (95.5%)

Copywriting / micro-copy: 12 responses (54.5%)

Ideation / concept generation: 11 responses (50%)

Accessibility tasks (alt-text, color, etc.): 10 responses (45.5%)

Wireframing / layout suggestions: 9 responses (40.9%)

Prototyping / code hand-off: 9 responses (40.9%)

Asset production (images, icons): 8 responses (36.4%)

Testing & feedback synthesis: 4 responses (18.2%)

High-fidelity UI creation: 3 responses (13.6%)

None: 0 responses (0%)

AI’s Impact on UX Productivity

The overall sentiment towards AI still remains skeptical. Most teams have not found any significant productivity gains – most people responding slightly negative view of AI’s impact on UX Productivity.

AI Productivity Impact

Alt Text: A vertical bar chart titled "Overall impact of AI on your team’s productivity so far" based on 23 responses. The chart uses a scale of 1 to 5 (likely representing "low" to "high" impact). The distribution is:

Rating 1: 3 responses (13%)

Rating 2: 9 responses (39.1%)

Rating 3: 8 responses (34.8%)

Rating 4: 2 responses (8.7%)

Rating 5: 1 response (4.3%)

Quality and accuracy seems to be the top-most barrier.

A horizontal bar chart titled "Top barriers to broader AI use" based on 23 responses. The barriers are ranked by frequency:

Quality / accuracy concerns: 19 responses (82.6%)

Brand consistency / tone: 15 responses (65.2%)

Legal / copyright / licensing: 11 responses (47.8%)

Cost: 11 responses (47.8%)

Data privacy / security: 9 responses (39.1%)

Leadership approval: 5 responses (21.7%)

Learning curve / skills: 4 responses (17.4%)
A pie chart titled "Are you or other creatives on your team currently generating images with AI?" based on 22 responses. The usage breakdown is:

Yes — experimenting (Red): 54.5%

Yes — regularly (Blue): 22.7%

No interest (Green): 13.6%

Not yet, but planning (Yellow): 9.1%
Alt Text: A horizontal bar chart titled "Primary purposes for AI-generated images (check all that apply)" based on 21 responses. The most common uses are:

Exploratory mood boards / concepts: 12 responses (57.1%)

Backgrounds / textures: 12 responses (57.1%)

Illustrations / icons: 10 responses (47.6%)

UI Mock-ups (hero banners, placeholders, etc.): 8 responses (38.1%)

Marketing or social media visuals: 7 responses (33.3%)

UI/UX mock-ups (hero banners, etc.): 3 responses (14.3%)

Other: 1 response (4.8%)

None: 1 response (4.8%)
A vertical bar chart titled "How willing are you/your organization or clients to use AI-generated visuals on live products (apps, websites, campaigns)?" based on 22 responses. The chart uses a scale of 1 to 5 (likely "not at all willing" to "extremely willing"). The distribution is:

Rating 1: 4 responses (18.2%)

Rating 2: 10 responses (45.5%)

Rating 3: 3 responses (13.6%)

Rating 4: 2 responses (9.1%)

Rating 5: 3 responses (13.6%)
A horizontal bar chart titled "Biggest concerns about using AI-generated visuals" based on 22 responses. The primary concerns are:

Legal/IP issues: 13 responses (59.1%)

Brand consistency: 13 responses (59.1%)

User perception / trust: 12 responses (54.5%)

Ethical bias / representation: 7 responses (31.8%)

Visual quality: 7 responses (31.8%)

None: 2 responses (9.1%)
A pie chart titled "In the next 12 months, do you expect your team’s AI usage to..." based on 22 responses. The projected trends are:

Increase slightly (Red): 40.9%

Increase significantly (Blue): 36.4%

Stay the same (Yellow): 22.7%

Decrease (Green): 0%
A vertical bar chart titled "How worried are you that GenAI could negatively impact your job security?" based on 22 responses. Respondents rated their concern on a scale of 1 to 5 (likely "not at all" to "extremely worried"):

Rating 1: 4 responses (18.2%)

Rating 2: 4 responses (18.2%)

Rating 3: 8 responses (36.4%)

Rating 4: 5 responses (22.7%)

Rating 5: 1 response (4.5%)
A vertical bar chart titled "How optimistic are you that GenAI will make you more productive?" based on 23 responses. Respondents rated their optimism on a scale of 1 to 5:

Rating 1: 5 responses (21.7%)

Rating 2: 3 responses (13%)

Rating 3: 8 responses (34.8%)

Rating 4: 3 responses (13%)

Rating 5: 4 responses (17.4%)

A horizontal bar chart titled "Which emotions best describe how you feel about GenAI at work? (check all that apply)" based on 23 responses. The reported emotions are:

Curious: 11 responses (47.8%)

Anxious: 8 responses (34.8%)

Overwhelmed: 8 responses (34.8%)

Excited: 7 responses (30.4%)

Empowered: 6 responses (26.1%)

Indifferent: 6 responses (26.1%)

Threatened: 0 responses (0%)

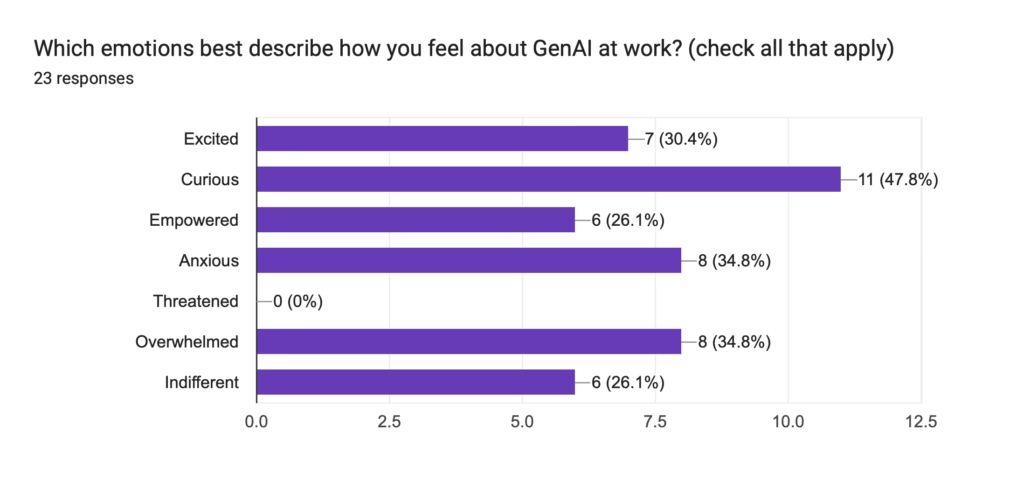
These responses paints a picture of design community adopting AI with some curiosity while being anxious and overwhelmed by ever-evolving tools and options in the market.

Designers may not be feeling Threatened (0%), but their moderate productivity ratings and low willingness to use AI in production suggest that AI still remains just a curious tool – not a significant productivity booster.

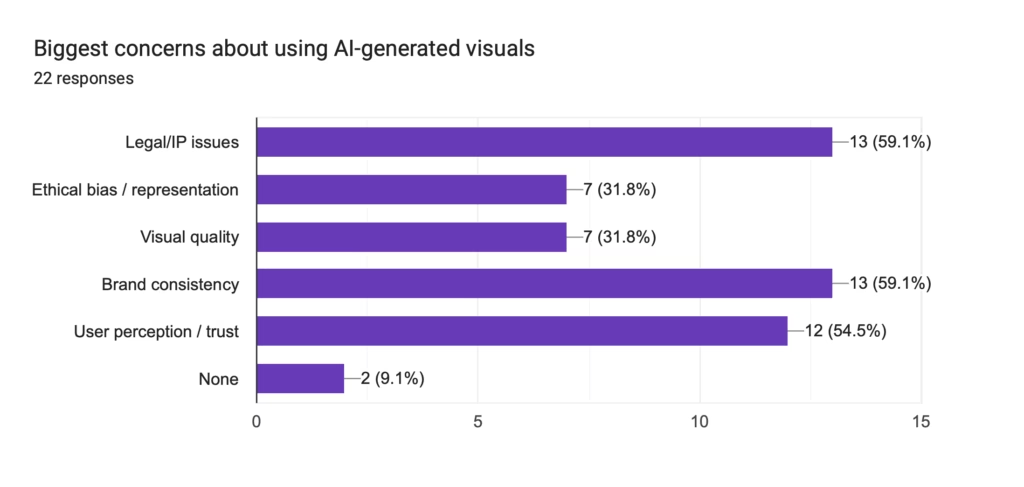
High Engagement, Low Trust: While majority of designers use AI for research and generating images, there is a clear hesitation to use these assets on live production due to quality and legal concerns.

AI isn’t necessarily increasing the productivity : Despite majority of respondents planning to slightly increase their AI usage in design, optimism about AI’s ability to actually make them more productive is still low.

Image Credit : Pexels / Lukas